The engagement rate formula is simple. Add up the likes, comments, shares and saves on a post, divide by an audience number, then multiply by 100. The tricky part is the audience number. You can divide by followers, by reach, by impressions or by video views, and each one gives a different answer for the same post.
Below you'll see each version with a worked example, a table to help you pick one, and honest notes on what a "good" rate looks like in 2026. If you just want the number, our free engagement rate calculator does the math in your browser.
Engagement rate formula (the short version)
| Version | Formula | Best for |
|---|---|---|
| By followers | Engagements ÷ followers × 100 | Comparing accounts, checking influencers |
| By reach (ERR) | Engagements ÷ reach × 100 | Judging one organic post you own |
| By impressions | Engagements ÷ impressions × 100 | Paid ads and boosted posts |
| By views | Engagements ÷ views × 100 | TikTok, Reels, Shorts and YouTube |
The basic formula
Every version follows one pattern:
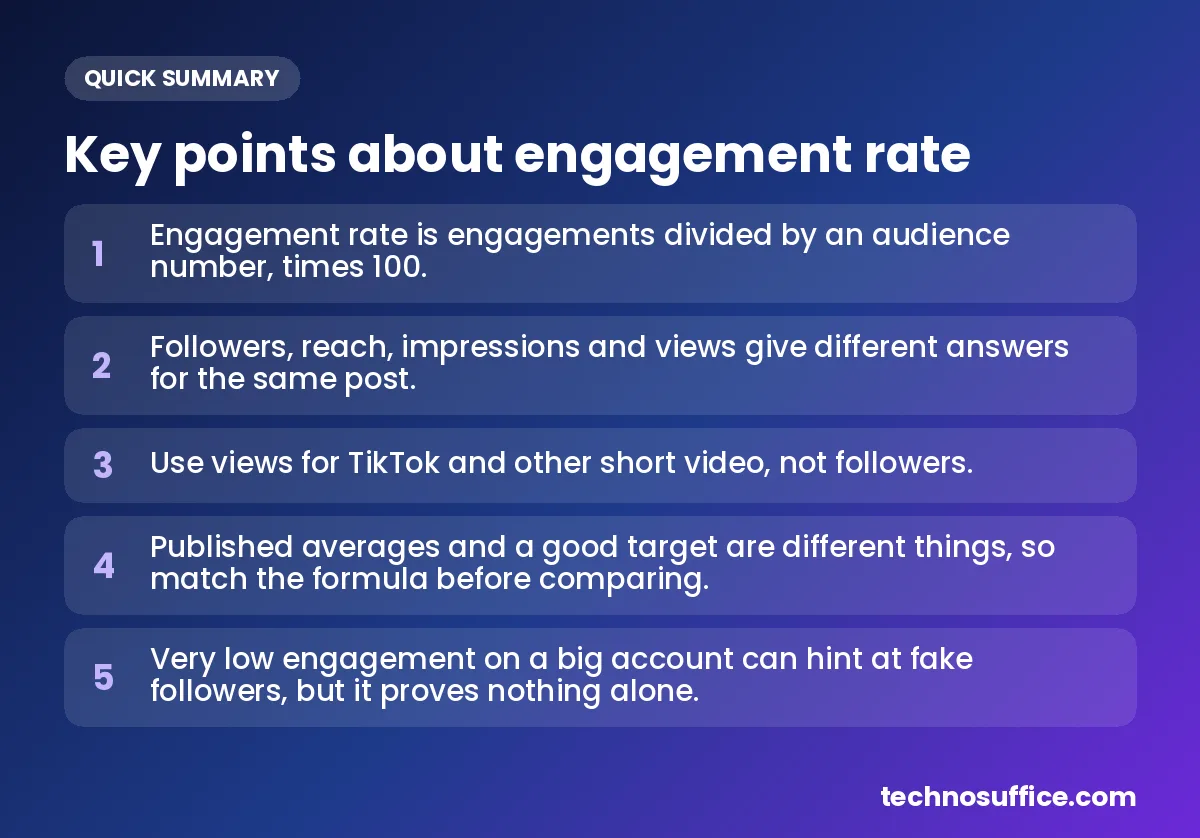
Engagement rate = total engagements ÷ audience × 100
Say a post gets 260 engagements and the account has 10,000 followers. That's 260 ÷ 10,000 = 0.026. Multiply by 100 and you get 2.6%. (These are example numbers we made up to show the math.) If you'd rather not do the division by hand, a simple percentage calculator works too.
What counts as an engagement
An engagement is any action someone takes on a post. Likes, comments, shares and saves are the usual four. Some tools also count link clicks or profile taps. Just scrolling past or watching a video is not an engagement.
This matters more than people expect. Some benchmark reports count only likes and comments. Our calculator lets you add shares and saves too. If two people count different actions, their rates can't be compared fairly.
Engagement rate by followers vs reach vs views
The four audience numbers measure different things. Here's what each one means and when it fits.
By followers
Followers are people who chose to follow an account. This version is often called "ER post" or "ER followers." Its big plus is that anyone can see a follower count. Its big minus is that many followers never see a given post, so the rate can look low even when the post did well.
A close cousin is daily engagement rate. You take all engagements on one day and divide by followers. It's handy for tracking how active an audience is, day to day.
By reach
Reach is how many different people saw a post. Each person counts once. Engagement rate by reach, often shortened to ERR, divides engagements by that number. Hootsuite's engagement rate guide calls it the most common formula. It also points out that reach includes non-followers who found the post through search, shares, hashtags or recommendations.
ERR answers a fair question: of the people who actually saw this post, how many reacted? The catch is that only the account owner can see reach.
By impressions
Impressions count how many times a post was shown, repeat views included. If one person sees a post three times, that's three impressions but only one person reached. So reach is always equal to or lower than impressions.
Impressions divided by reach gives you frequency, which is how many times the average person saw the post. Engagement by impressions is common for paid ads, where you pay for each showing. For ads, you may also track cost per engagement (money spent ÷ engagements). That's a dollar figure, not a percent.
By views (video)
Views count how many times a video or post was played or shown on screen. Repeat views count. For TikTok, Reels, YouTube Shorts and long YouTube videos, views are the most natural audience number, because these apps push videos to people who don't follow you.
Same post, three answers (worked example)
Here's one made-up post with 200 likes, 25 comments, 15 shares and 20 saves. That's 260 engagements in total. Watch what happens with each audience number.
| Audience number | Value | Math | Engagement rate |
|---|---|---|---|
| Followers | 10,000 | 260 ÷ 10,000 × 100 | 2.6% |
| Views | 6,500 | 260 ÷ 6,500 × 100 | 4% |
| Reach | 4,000 | 260 ÷ 4,000 × 100 | 6.5% |
Same post, same people reacting, yet the rate runs from 2.6% to 6.5%. None of these is wrong. They just answer different questions. This is why you should always say which formula you used when you share a number.
 Key points about engagement rate
How the calculation works, in plain words
An engagement rate is a share. The top number is "people who did something." The bottom number is "people who could have done something." The bigger the bottom number, the smaller the rate.
Followers is usually the biggest bottom number for a small or mid-size account, because most followers never see a given post. Reach is often smaller, so the rate goes up. Views sit in between here because some people watched more than once. On TikTok the order can flip, since a video can reach far more people than the account has followers. Once you see it this way, the different results stop looking strange.
Which formula should you use?
Decision table by goal
| Your goal | Use this formula | Where the number comes from |
|---|---|---|
| Compare creators or brands | By followers | Public profile and public likes and comments |
| Judge how good one of your organic posts was | By reach | Your app's built-in stats |
| Check a paid ad or boosted post | By impressions | The ad platform, such as Meta Ads Manager |
| Judge a TikTok, Reel or YouTube video | By views | The video's analytics screen |
| Track audience activity over time | Daily ER by followers | Your own daily stats |
When you can't see reach (competitors, influencers)
Reach lives inside the account owner's private stats. When you look at a competitor or an influencer, you only see their follower count plus public likes and comments. So a follower-based rate is the realistic choice. You also won't see their saves or shares in most cases. Keep that in mind when you compare their rate with your own full numbers.
How to calculate engagement rate step by step
- Pick your formula from the table above, and write it down.
- Choose your posts. One post tells you about that post. Several posts tell you about the account.
- Collect likes, comments, shares and saves for each post. Use the same actions every time.
- Find the audience number: followers, reach, impressions or views.
- Divide engagements by the audience number.
- Multiply by 100 to turn it into a percent.
- Write the result next to the formula you used, so future you can compare like with like.
Average several posts
A single post can be lucky or unlucky. Our tool page suggests using your last 10 posts for a more reliable average. If one post went viral, check the average with and without it. One big post can lift the average a lot.
This is where the median helps. The median is the middle value when you line up your posts from lowest to highest. The average adds everything and divides. A couple of viral posts pull the average up, but they barely move the median.
Total-then-divide vs average-the-percentages
There are two ways to average posts, and they don't always match. Hootsuite works out each post's rate first, then averages those rates. Our calculator adds up totals across posts and works from those totals.
Here's a made-up example to show the gap. Post A gets 50 engagements on 500 reach, which is 10%. Post B gets 300 engagements on 10,000 reach, which is 3%. Averaging the two rates gives 6.5%. Adding the totals first gives 350 ÷ 10,500, which is about 3.3%. The first method treats each post equally. The second gives more weight to posts that reached more people. With similar posts the gap is small. With very uneven posts it can be large. Pick one method and stay with it.
Using the TechnoSuffice engagement rate calculator
- Open the engagement rate calculator and choose a platform: Instagram, TikTok, YouTube, Facebook, LinkedIn or X.
- Under Calculate by, pick Followers (profile engagement), Reach (people who saw the post) or Views / impressions.
- Enter Likes / reactions, Comments, Shares / reposts and, if you have them, Saves (optional).
- Enter your audience number for the method you chose.
- In Number of posts (totals of), enter how many posts your totals cover. Use 1 for a single post.
- Read your rate and its rating: Low, Average, Good or Excellent. The tool also shows the formula, so you can see exactly how it got there.
Instagram engagement rate calculator: where to find your numbers
Followers formula
For any public Instagram account, you can see followers, likes and comments. That's enough for a follower-based rate. Saves and shares usually aren't public, so leave them out for other accounts, or your comparison won't be fair.
Reach formula with Insights
Instagram Insights is the app's free, built-in stats area. Meta says it's only available for business and creator accounts, so a personal account needs to switch first. Open one of your posts and look for its insights, or open the Professional Dashboard. "Accounts reached" is Instagram's name for reach. "Accounts engaged" is the number of different people who interacted. Menu labels can change, so look for those terms if a button has moved.
For reels, Meta counts an account as reached when the reel appeared on that person's screen at least once, even if it didn't play.
Views vs impressions after Instagram's change
Last year, Instagram replaced organic impressions with a Views metric as its main headline number. Sources differ on the exact month, but the effect is the same: for regular posts and reels, you'll mostly see views now. Impressions for paid ads still appear in Meta Ads Manager. In our calculator, use Views / impressions for either one.
TikTok engagement rate formula
Why views are the usual denominator
Most TikTok views come from the For You feed, TikTok's main feed. It shows videos to people who don't follow you. So follower count tells you little about who saw a video. Use this instead:
TikTok engagement rate = (likes + comments + shares + saves) ÷ views × 100
Why a followers-based TikTok rate can pass 100%
Take a made-up account with 2,000 followers. One video gets 50,000 views and 2,400 engagements. By followers, that's 2,400 ÷ 2,000 × 100 = 120%. That looks broken, but it isn't. The video simply reached far beyond the follower base. By views, the same video comes out at 4.8%, which is a much more useful number.
What is a good engagement rate?
There's no single answer, and anyone who gives you one number without a formula is skipping a step. "Good" depends on the platform, the formula, which actions are counted and the size of the account.
Why benchmark reports disagree
Benchmark reports come from companies like Socialinsider, Quid (formerly Rival IQ), Hootsuite, Buffer and Sprout Social. A benchmark is a typical number from other accounts that you use to judge your own. Each company picks different accounts, counts different actions and divides by different numbers. Quid, for example, publishes an Instagram median that comes in lower than Socialinsider's average. Before you compare yourself with any report, check its formula and match it.
Published averages vs our tool's rating bands
Socialinsider's Instagram benchmarks put the average at 0.48%, down 24% from the year before. That figure comes from 35 million posts across 447,613 pages in 2025. It counts only likes and comments, divided by followers.
Our calculator's bands are higher. For Instagram by followers, it treats 1–3% as typical, above 3% as good and above 6% as excellent. We want to be upfront about that gap. There are a few reasons for it. Big brand pages pull published averages down. Our tool can count shares and saves, which adds to the top number. And a "good" target should sit above the average, not at it. Still, our bands are rough guides, and they're generous. If you score "Low" in our tool but beat the published average, you're doing better than most pages.
Account size matters
People often group accounts by size: nano, micro, macro and mega, from smallest to largest. Smaller accounts usually show higher rates, partly because their followers tend to be closer to them. Compare yourself with accounts of a similar size. Your own past numbers are often the best benchmark of all.
Social media engagement rate benchmarks by platform
| Platform | Published average | Our tool's rough bands |
|---|---|---|
| 0.48% by followers, likes and comments only (Socialinsider) | 1–3% typical, 3%+ good, 6%+ excellent (by followers) | |
| TikTok | 2.60% by followers; 3.30% by views (Socialinsider) | 4–8% common, 10%+ excellent (by views) |
| LinkedIn, Facebook, YouTube, X | No figure we could verify well enough to quote | The tool gives a rating, but compare with your own history first |
The TikTok figures come from Socialinsider's 2026 benchmarks and methodology, which reports the follower-based TikTok average as down 10% from the year before. Socialinsider calls anything above its by-views average a good rate. Again, our tool's bands sit higher, so treat them as a stretch target rather than a pass or fail line.
Common mistakes and how to fix them
| Problem | Why it misleads | Fix |
|---|---|---|
| Dividing TikTok engagement by followers | Views come from the For You feed, so rates can pass 100% | Divide by views |
| Mixing definitions | Likes-only rates look lower than likes, comments, shares and saves | Count the same actions as the report you compare with |
| Mixing paid and organic numbers | Ads add impressions and engagements that organic posts don't get | Keep ad numbers from Meta Ads Manager in a separate rate |
| One viral post in your average | It lifts the average far above a normal week | Check with and without it, or use the median |
| Comparing small and large accounts | Smaller accounts usually have higher rates | Compare with similar-size accounts |
| Switching averaging methods | Average-of-rates and total-then-divide can differ | Pick one method and keep it |
Tips to keep your numbers useful
- Track the same formula every month in a simple sheet. Trends matter more than one number.
- Note the post type next to each rate. Reels, carousels and single photos often behave differently.
- Plan posts ahead so you can test one change at a time. Our guide to a social media content calendar shows a simple way to do that.
- Look at comments and shares, not just the percent. A post with fewer likes but more shares may have done more for you.
- Use relevant hashtags so posts reach people who care. A hashtag generator can give you ideas to start from.
Using engagement rate to spot fake followers
What a low rate can and can't tell you
Fake followers, often bots, are accounts that aren't real people. They follow but never react, so they drag the rate down. Our tool page flags a large account with engagement under 0.5% as a possible warning sign.
A low rate alone proves nothing, though. A big account can have a low rate because its followers are older and less active, or because it posts a lot. Look for other clues too. Check for comments that say nothing specific, sudden follower jumps and many followers with no posts or profile photo. If you're paying an influencer, ask them to share screenshots of their own reach and views.
FTC rule on buying fake followers (US)
The Federal Trade Commission (FTC) is the US agency that fights deceptive business practices. Its rule on fake reviews also bans buying or selling fake social media signals, like bot followers or views. It applies when the buyer knew, or should have known, they were fake and used them to look more influential for business. In plain words: buying followers to impress clients or brands can get you in legal trouble, not just bad numbers.
Privacy and limits
Calculated in your browser, nothing saved
Our calculator runs the math in your browser, and nothing you type is saved. You don't need to log in or connect any social account.
What benchmarks can't tell you
A benchmark tells you how you compare. It doesn't tell you whether a post brought in sales, sign-ups or calls. A post with a modest rate can still win if the right people reacted. Use engagement rate as one signal next to your real business goals.
Frequently Asked Questions
What is a good engagement rate on Instagram?
It depends on the formula. Socialinsider's published average is 0.48% by followers, counting only likes and comments. Our tool treats 1–3% by followers as typical and above 3% as good, but those bands are generous. If you beat the published average for your formula, you're ahead of most pages. Comparing with your own past posts is often more useful.
Is engagement rate better by followers or by reach?
Reach is better for judging how good one of your own posts was, because it only counts people who saw it. Followers is better for comparing accounts, because everyone can see follower counts. Neither is "right." Just don't compare a reach-based rate with a follower-based one.
Do saves and shares count as engagements?
Yes, most people count them, and they're often a strong sign that a post was useful. Our calculator includes shares and lets you add saves. Some benchmark reports count only likes and comments, though. When you compare against a report, count the same actions it does.
Why is my TikTok engagement rate over 100%?
You probably divided by followers. TikTok shows videos to many people who don't follow you, so engagements can be higher than your follower count. Divide by views instead and you'll get a more sensible number.
How many posts should I use for an average?
Our tool page suggests your last 10 posts. That's enough to smooth out one lucky or unlucky post. If one of them went viral, run the numbers with and without it so you see both pictures.
Can I use this for LinkedIn or Facebook?
Yes. The formula works the same way on LinkedIn, Facebook, YouTube and X. Our calculator has options for each. We didn't find published benchmarks for those platforms that we trust enough to quote here, so lean on your own history when you judge the result.
Pick one formula and stick with it
The engagement rate formula never changes: engagements divided by an audience number, times 100. What changes is the audience number, and that choice should match your goal. Use followers to compare accounts, reach for your own posts, impressions for ads and views for video. Then track the same way every month.
Ready to check your own numbers? Try the free TechnoSuffice engagement rate calculator. If you'd like help turning those numbers into a real plan, take a look at our social media marketing service and ask for a free quote.